
A new website produced by the Missouri Department of Health and Senior Services, Department of Natural Resources and researchers at the University of Missouri is flush with information about how COVID-19 shows up in the state's sewer systems.
After wading through the data - and 2,000-plus sewage samples - Missouri's sewershed surveillance team has revealed important insights about how increases in SARS-CoV-2 particles in wastewater can predict surges in cases among humans.
Each week, the researchers test samples from 59 community wastewater facilities, including Fulton's, for the genetic markers of SARS-CoV-2, the virus that causes COVID-19. The results of those tests are mapped in interactive graphics on the new website, which can be viewed at bit.ly/38hrRGj.
"We are willing and excited to help in this project, since it seems to help everyone: not just us, DNR or the university," said Anna Zerr, Fulton's wastewater supervisor. "It is a combination of all parties working together."
The map will be updated weekly, the DNR stated.
"As the outbreak continues, this program remains an effective tool for trends analysis to be used with other measures of viral spread in a monitored population," said Jeff Wenzel, bureau chief of DHSS's Bureau of Environmental Epidemiology.
Studies in the Netherlands, Italy and United States found a direct correlation between the amount of SARS-CoV-2 genetic material in sewage and the number of reported cases within a given "sewershed," or the area that drains into a community's wastewater collection system, according to the DNR.
While the virus that causes COVID-19 is new, using wastewater for tracking disease is not. Wastewater testing has proven useful in tracking diseases such as polio and norovirus and is becoming a useful tool for SARS-CoV-2 surveillance. The SARS-CoV-2 virus particles are shed in human feces by many infected individuals, including those who are symptomatic and asymptomatic. These particles can be detected in wastewater by testing for specific genetic markers.
Viral shedding in feces may occur for up to 30 days after infection.
That doesn't mean the disease can spread through wastewater - as far as scientists know, it can't - only that the signs it leaves behind after passing through a person can be detected there.
Finding patterns
The City of Fulton joined the project in July. Other nearby contributors include the Jefferson City Regional Water Reclamation Facility and the wastewater treatment plants in Mexico and Columbia.
Since then, Fulton and the other participants have provided enough data for the wastewater surveillance team to begin finding patterns.
These findings currently indicate sewershed testing best correlates with human case data with a four- to six-day lag, meaning this may be an early indication of increasing trends of COVID cases. The data also shows a 40 percent increase in sewershed viral load over a week, or two consecutive weeks of 25 percent increases or greater, is followed by at least a 25 percent increase in measured human cases about 70 percent of the time.
This pattern holds true despite the many differences between the areas where testing occurred - wastewater flow rates, population changes, rate of COVID-19 testing in the populace and more. (However, those differences mean it's impossible to directly compare sewershed readings between different facilities and communities, the DNR said.)
Fulton's results
The City of Fulton drew samples at the municipal wastewater plant and at the Fulton Reception and Diagnostic Center. In August, the city placed another sampling device at the Fulton State Hospital. Devices stationed at each location drew a small amount of water each hour for 24 hours, combining each day's samples into a composite sample. Once a week, Fulton dropped off the samples with the DNR.
The sampling process continues, though the Department of Corrections took over sampling at the FRDC in November.
"The state has supplied us with sampling equipment and necessary sampling bottles and boxes to take to designated drop off locations or labs," Zerr said. "For the most part, it has been very smooth and not really any issues."
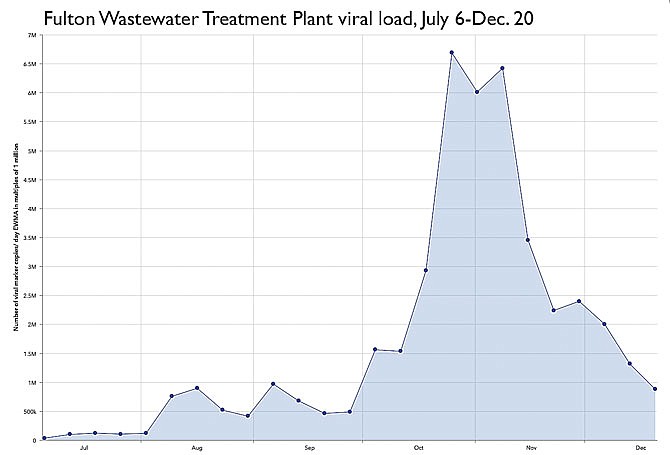
The results of testing on those samples are charted on the new website, with each data point representing an exponentially weighted moving average of the number of virus marker copies found in the samples tested around that date. Numbers are given in multiples of one million - so a "one" on the website's chart actually represents one million viral markers.
The Sewershed Surveillance Project site appears only to chart the data from the Fulton Wastewater Treatment Plant, excluding the samplers at the FRDC and FSH.
Fulton's viral load was relatively low throughout July, never rising above 110,000 million markers per sample. The load began climbing in August and September, ranging between 416,400 million and 899,200 million.
A rapid and exponential rise began at the end of September. By Oct. 4, Fulton was up to 1.6 million parts. The climb peaked Oct. 26 at 6.7 million, remaining above 6 million until Nov. 8, when the load began dropping as rapidly as it climbed.
Fulton's load has been on a downward trend ever since, aside from a small upward hiccup Nov. 29. As of the website's most recent update on Dec. 20, it stood at 881,000 million - a similar viral load to mid-August.
However, the Sewershed Surveillance Project's graphic defines "decreasing" as a drop in viral load by 40 percent or more in each of the last three weeks. By that definition, Fulton's viral load shows as "no change," as do the viral loads in Jefferson City, Columbia and Mexico.
The Callaway County Health Department only sporadically makes public data on active cases within Fulton city limits, so there's no way to compare the DNR's viral load data to Fulton's active case count.
However, the CCHD has provided regular updates on cases within Callaway County as a whole, which do roughly mirror the trends shown in the DNR's viral load data.
Active cases in the county started skyrocketing about a week into October, shooting from 101 on Oct. 1 to 399 on Oct. 30. However, the upward trend in active cases continued until Nov. 20, peaking at 795. Cases then boomeranged up and down until Dec. 7, peaking again at 727, before beginning a steady decline.
As of its last updated Wednesday, the CallawayCOVID19.com website showed 435 active cases in Callaway County, plus a further 40 at Missouri Department of Corrections facilities and one at the Fulton State Hospital. There were 103 active cases among Fulton's residents, down from 120 on Dec. 29, 141 on Dec. 10 and 164 on Dec. 8. (Fulton's numbers exclude any cases at the city's two colleges and the Fulton Reception and Diagnostic Center.)
On Dec. 1, a mask ordinance went into effect within Fulton city limits. According to the U.S. Centers for Disease Control and Prevention, widespread wearing of cloth masks in public is an effective way of decreasing transmission of COVID-19.
"I think the mask ordinance has done what it was supposed to do - getting more people to wear masks," Cannell said Tuesday.